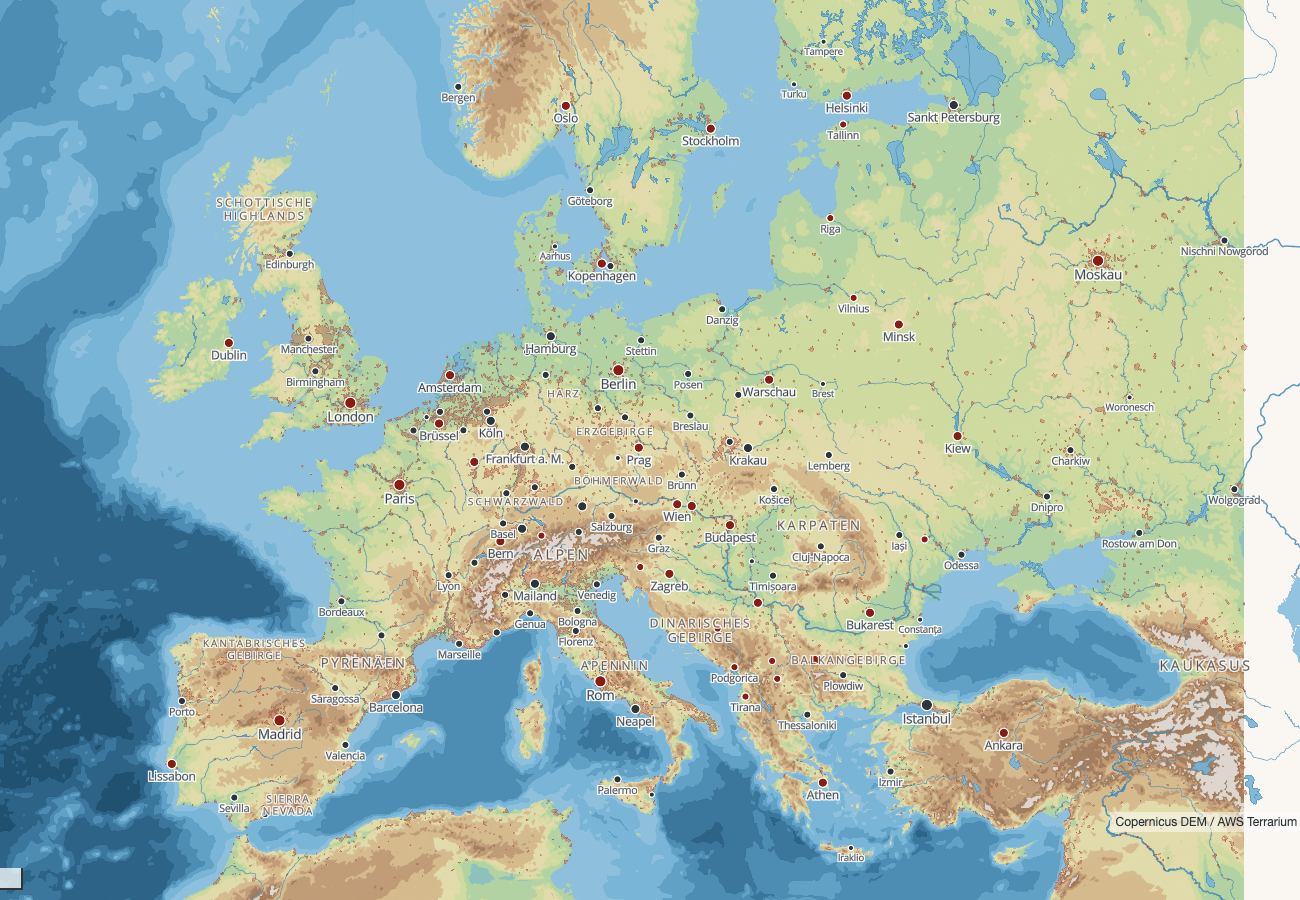
Interactive European Atlas
Web · In development
An ongoing experiment in how physical geography can be represented on screen, and in the rendering stack required to do it — layered relief, hypsometric colour, bathymetric steps and typography that has to stay legible from continent to valley.
Everything is derived from independently sourced open data: a Python pipeline bakes terrain rasters from DEM tiles and compiles vector tiles into PMTiles, which a MapLibre client styles at run time. The interesting problem turned out not to be the rendering but the hierarchy. Relief, water, settlements and labels all compete for the same tonal range, and the map only reads well when each is allowed to recede at the zoom levels where it is not the subject — which makes every styling decision a question about what the reader is looking for at that scale.
MapLibre GL JS · TypeScript · Vite · Python · PMTiles